Discuss Diagnosis Methods with Medical Theme Layout

Product Description
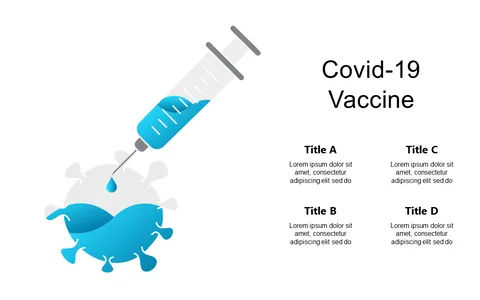
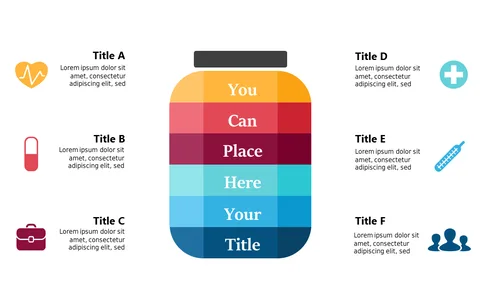
When discussing diagnosis methods in healthcare, visual clarity can make all the difference in effectively communicating vital information. This slide, designed with medical visuals like a stethoscope and thermometer, helps you present complex concepts in an engaging manner, ensuring that your audience stays focused.
You’ll find this useful whether you’re a healthcare manager giving a presentation at a medical conference or a doctor explaining diagnosis techniques during a staff meeting. Medical students discussing their findings or researchers presenting innovative diagnostic methods will also benefit from this clear layout.
At just $0.99, this slide is ready for instant download and is easily editable in PowerPoint and Google Slides.
You can customize colors and sizes to fit your specific needs in just minutes.
$0.99 – Purchase Checkout
Added to cart