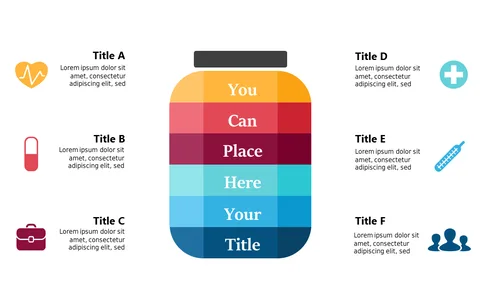
Showcase Health Metrics with Editable Layout

Product Description
Clearly presenting health metrics is crucial when you’re trying to make informed decisions based on data. You don’t want to overwhelm your audience, but you do need to get your point across effectively.
This editable layout helps you present your metrics concisely without sacrificing clarity. Clinical managers, healthcare analysts, and quality assurance teams will find this slide particularly useful for meetings and reports where performance indicators are discussed. It’s an excellent choice for case reviews, departmental updates, or any situation where clear metrics are necessary for discussion.
You can grab this slide for only $0.99 and have it available for instant download. It’s easily editable in both PowerPoint and Google Slides, allowing you to tailor it to your specific needs in mere minutes.
$0.99 – Purchase Checkout
Added to cart