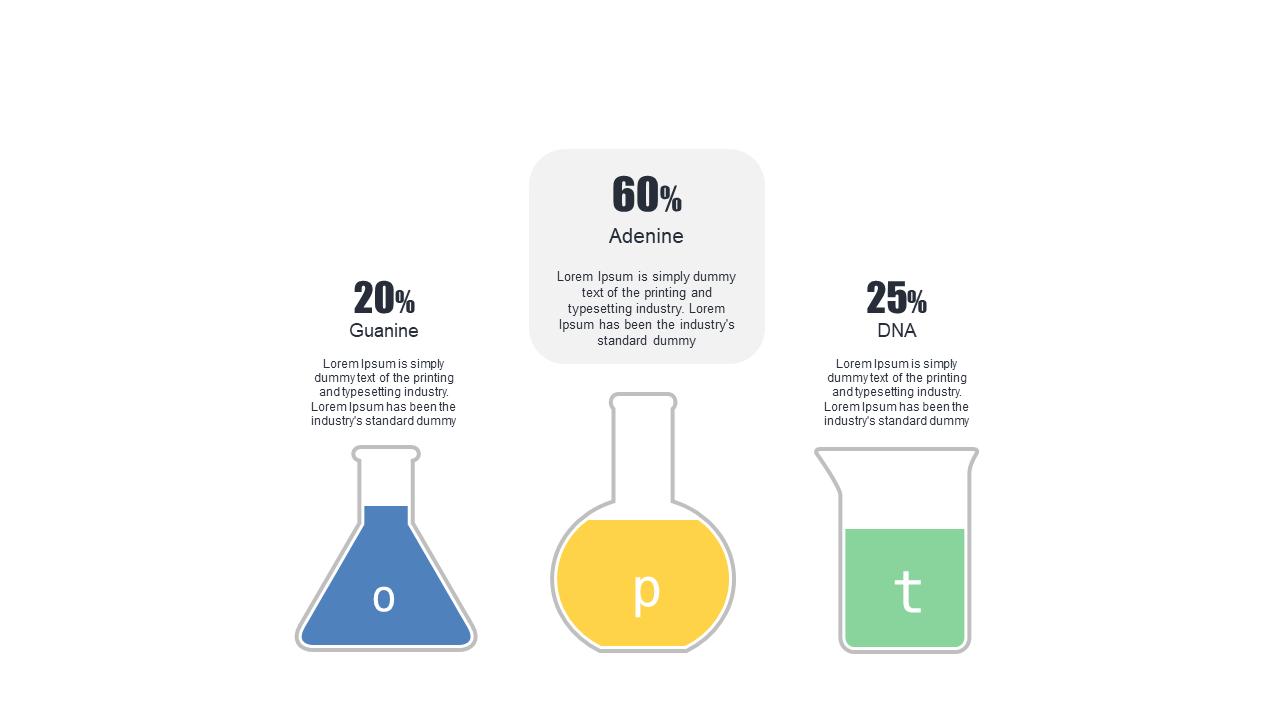
Visualize DNA Composition with Infographic
Product Description
Communicating complex scientific information can be overwhelming, especially when it comes to topics like DNA composition. This infographic slide simplifies the details, offering a visually striking representation of DNA components with precise percentage values that make understanding easier.
This slide is perfect for biologists presenting research findings, educators teaching genetics, or healthcare professionals discussing genetic implications in a conference. It allows you to convey intricate details clearly and effectively in any setting.
At just $0.99, you can download this slide immediately, and it’s fully editable in both PowerPoint and Google Slides. Simplify your communication and ensure your audience grasps the details they need.
$0.99 – Purchase Checkout
Added to cart