Diagnosis Presentation Layout for Healthcare Insights

Product Description
Presenting complex healthcare data can be overwhelming, particularly when trying to convey essential insights. You need a way to communicate your findings clearly and engagingly, and this diagnosis presentation layout helps you do just that.
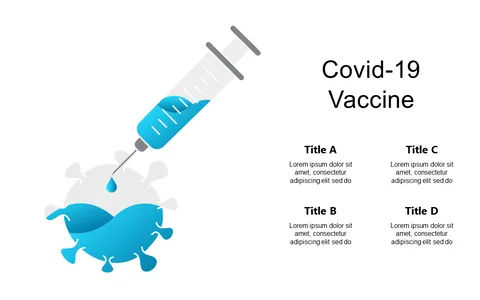
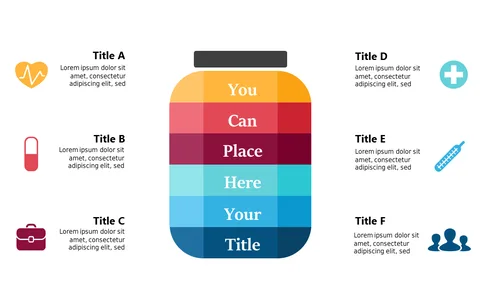
With its compelling illustration, it draws attention while relaying your message effectively. This slide is perfect for healthcare professionals, data analysts, or public health officials who need to present findings during team meetings, conferences, or client briefings. Whether you’re discussing patient outcomes, research data, or healthcare trends, this engaging layout can make your information more digestible for your audience.
Available for only $0.99, this slide is ready for instant download and fully editable in PowerPoint and Google Slides. Modify it with your data and insights, and you’ll be prepared to present in just a few minutes.
$0.99 – Purchase Checkout
Added to cart