Color-Coded Info Cards for Effective Presentations
Product Description
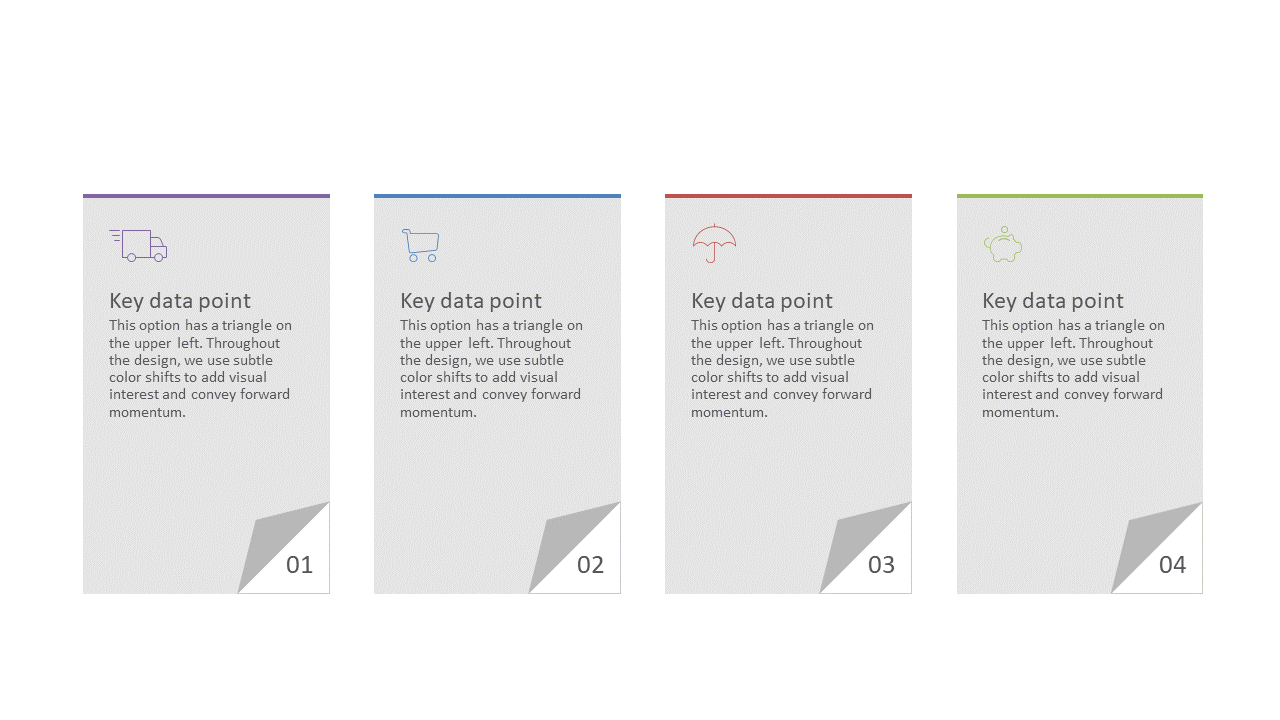
When faced with a room full of people, presenting complex information can be daunting, often causing your audience to disengage. This slide features color-coded information cards that break down key data points in an engaging way, preventing anyone from feeling overwhelmed by the details.
It’s designed to promote clarity in your presentations. Marketing analysts or business developers delivering performance reports will find this layout especially useful during team meetings or client pitches. It’s also a great choice for educators looking to summarize intricate topics for students or workshop participants.
For just $0.99, you can easily download this slide and customize it to suit your presentation style. It’s compatible with PowerPoint and Google Slides, allowing you to make adjustments quickly and effectively.
$0.99 – Purchase Checkout
Added to cart