Summarize Information with Colored Rectangles
Product Description
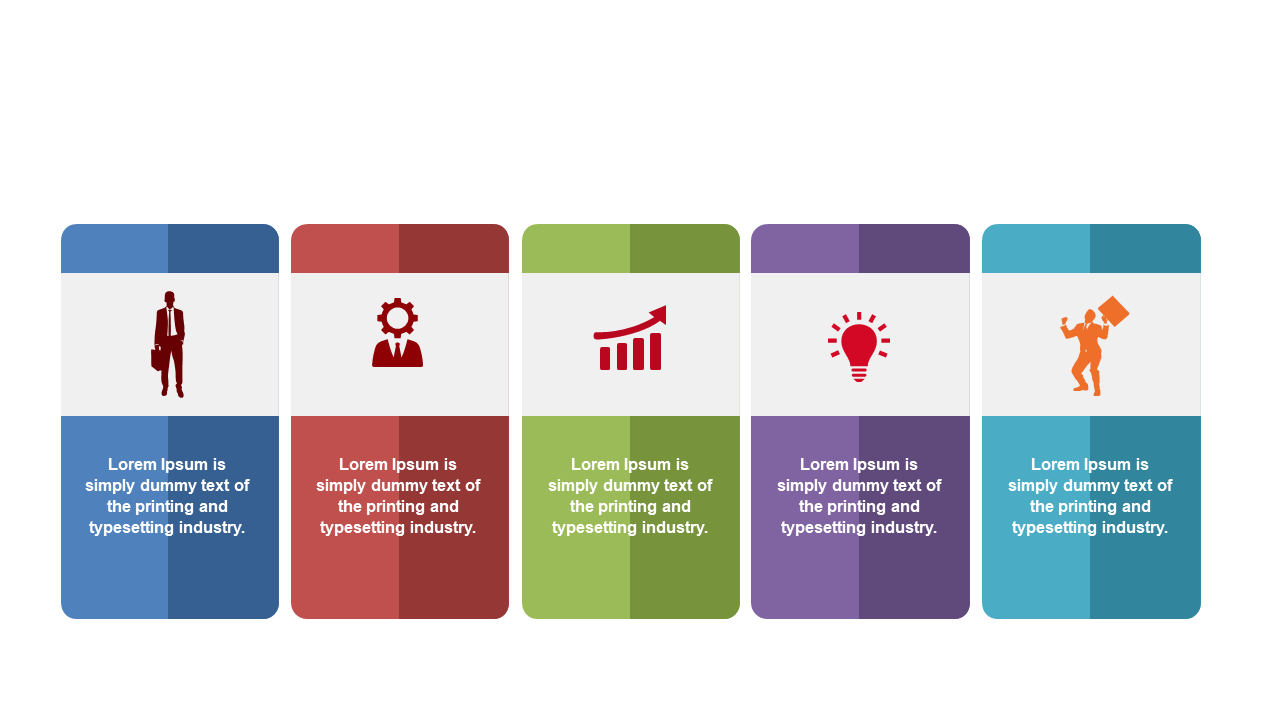
Finding a clear way to present crucial information can be challenging in fast-paced environments. This slide’s vibrant colored rectangles, paired with icons, effortlessly summarize key points, ensuring your audience stays engaged and informed.
Perfect for analysts reporting findings, educators summarizing course content, or team leads updating project statuses, this slide helps you convey essential information quickly. It’s tailored for any setting where you need to capture attention and deliver clarity simultaneously.
You can get this slide for only $0.99, ready for immediate download and easy editing in PowerPoint or Google Slides. In just a few clicks,
you can customize it to fit your needs.
$0.99 – Purchase Checkout
Added to cart
✅ Instant delivery
✅ Fully editable
✅ PowerPoint & Google Slides
Category:
$0.99
Per slide · No minimum · Pay only for what you pick
✓ $0.99/slide
No minimum order
✓ Mix any category
No subscription
Building a full deck?
Mix slides from any of our 58 categories —
all merged into one PowerPoint.
$0.99/slide, no minimum.
Browse All Slides →