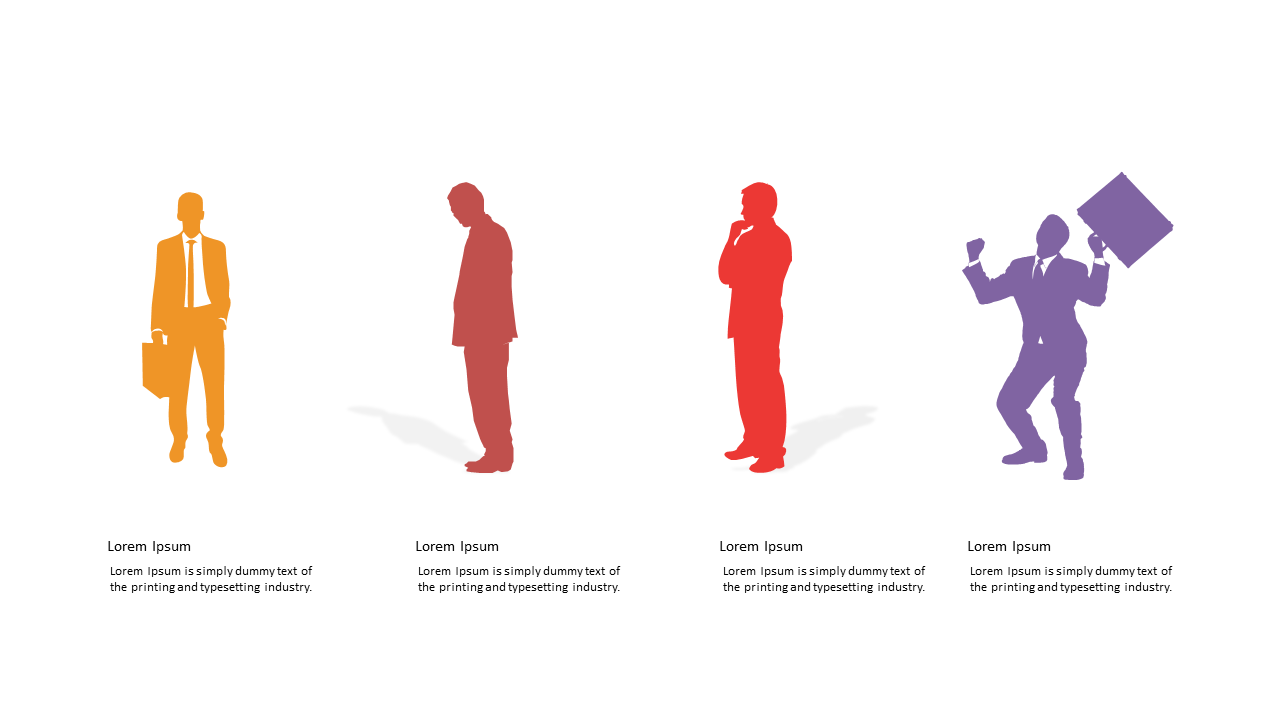
Visualize Team Engagement with Businessman Silhouettes
Product Description
Showcasing team engagement levels can be tricky, but striking visuals can convey your message effectively. If you’re struggling to illustrate various states of team involvement, this slide featuring businessman silhouettes provides a clear and impactful representation of engagement dynamics.
It simplifies the discussion around team performance and dynamics. HR professionals, team leaders, and organizational consultants can use this slide during team meetings, performance reviews, or engagement workshops. Whether you’re analyzing employee satisfaction or presenting team feedback, this visual can help facilitate those conversations.
For just $0.99, you can instantly download this slide and edit it seamlessly in PowerPoint or Google Slides. It’s designed for easy customization, allowing you to tailor it to your specific needs in just minutes.
$0.99 – Purchase Checkout
Added to cart