Present Data Composition with Segmented Circular Diagram V4
Product Description
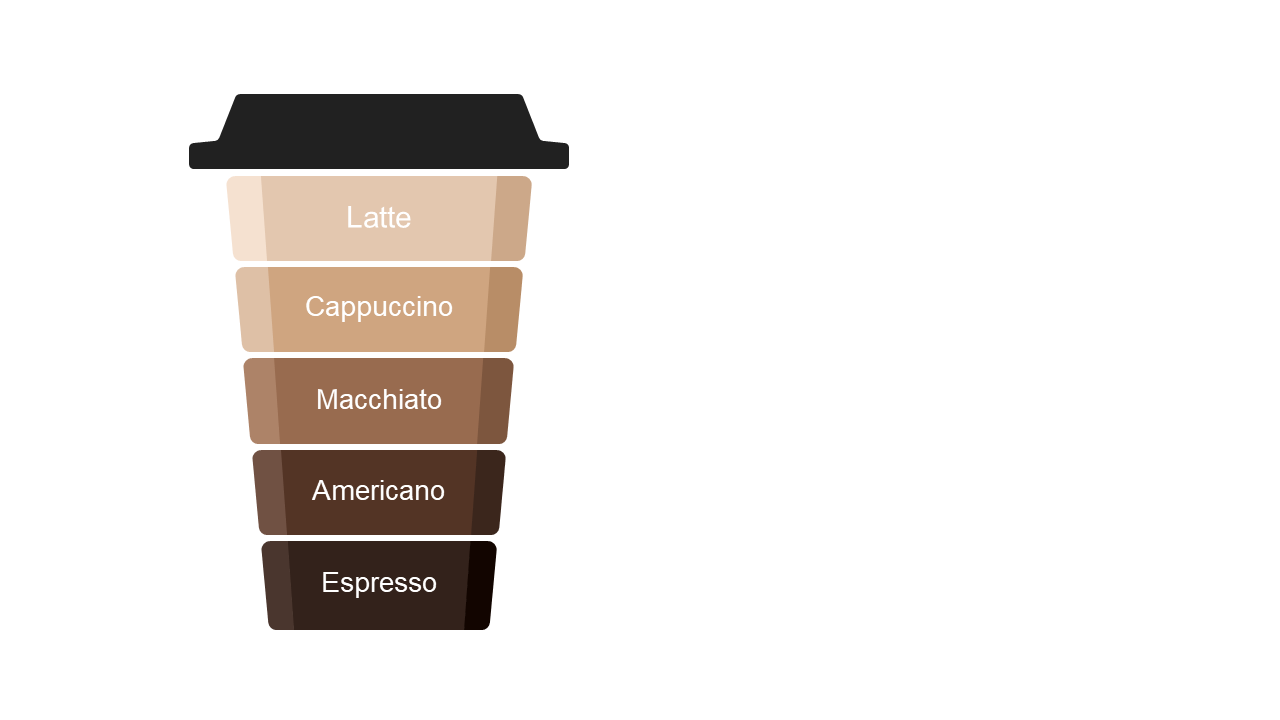
When you need to present complicated data under tight deadlines, having a clear and engaging visual can make all the difference. This segmented circular diagram helps you do just that, breaking down your information into distinct sections that are easy to interpret.
Consider using this slide during sales forecasts or market analysis meetings if you’re a sales director or business analyst. It’s also helpful for project managers needing to relay market insights to their teams effectively.
Available for just $0.99, this slide is ready for instant download and can be edited seamlessly in both PowerPoint and Google Slides. Adjust the content to align with your message quickly and effectively.
$0.99 – Purchase Checkout
Added to cart
✅ Instant delivery
✅ Fully editable
✅ PowerPoint & Google Slides
Category:
$0.99
Per slide · No minimum · Pay only for what you pick
✓ $0.99/slide
No minimum order
✓ Mix any category
No subscription
Building a full deck?
Mix slides from any of our 58 categories —
all merged into one PowerPoint.
$0.99/slide, no minimum.
Browse All Slides →







