Showcase Key Metrics with Circular Indicators
Product Description
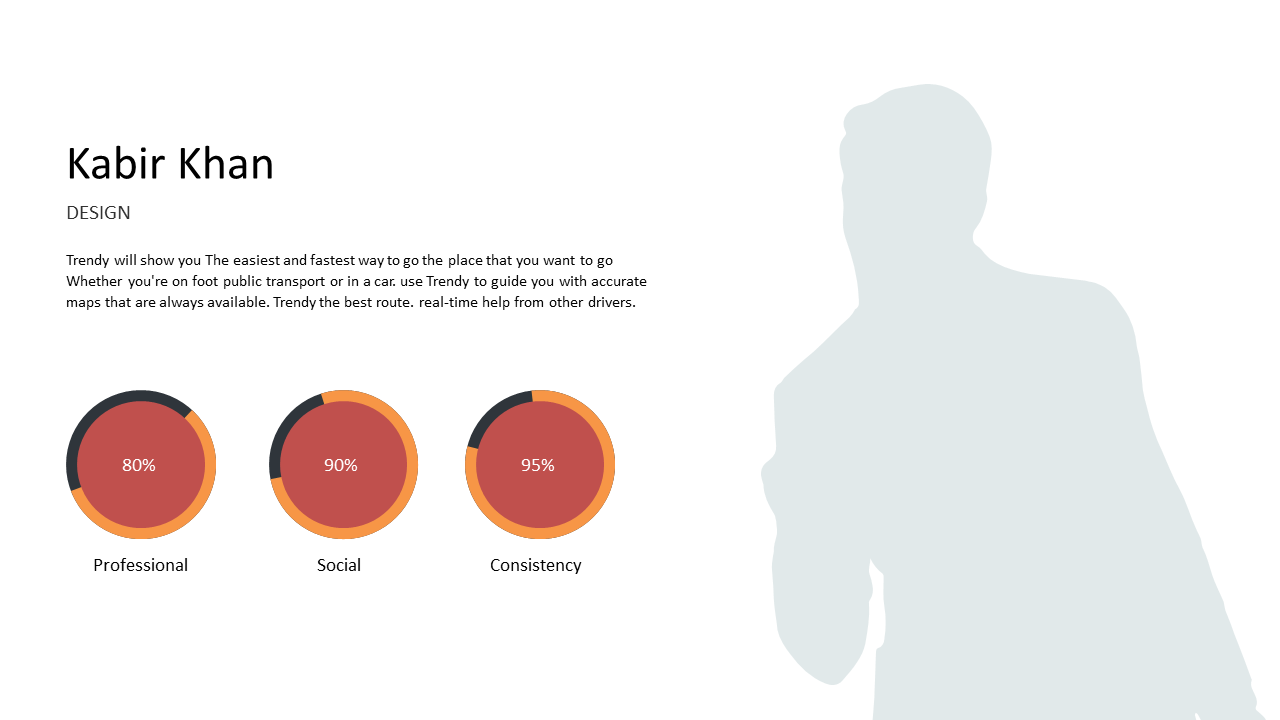
When you need to present key metrics, grabbing your audience’s attention can often feel like a daunting task. Traditional methods can be dull and fail to engage listeners, which detracts from the numbers you’re trying to showcase.
This slide offers a fresh approach with circular indicators that make your data pop in a visually appealing way. Marketing professionals or sales analysts will find this slide particularly useful during quarterly reviews or sales pitch meetings. Use it to highlight growth metrics, performance KPIs, or even customer engagement stats; it transforms complex data into something that your audience can easily digest and remember.
At just $0.99, this slide is yours with an instant download. You can quickly edit it in PowerPoint or Google Slides, making it simple to customize for any meeting or presentation setting.
$0.99 – Purchase Checkout
Added to cart