Visualize Real Estate Data with a 3D Bar Chart
Product Description
When you’re trying to present real estate data, it can be overwhelming to find a way to display complex figures without losing your audience’s interest. A cluttered visual can leave key points obscured and important insights overlooked.
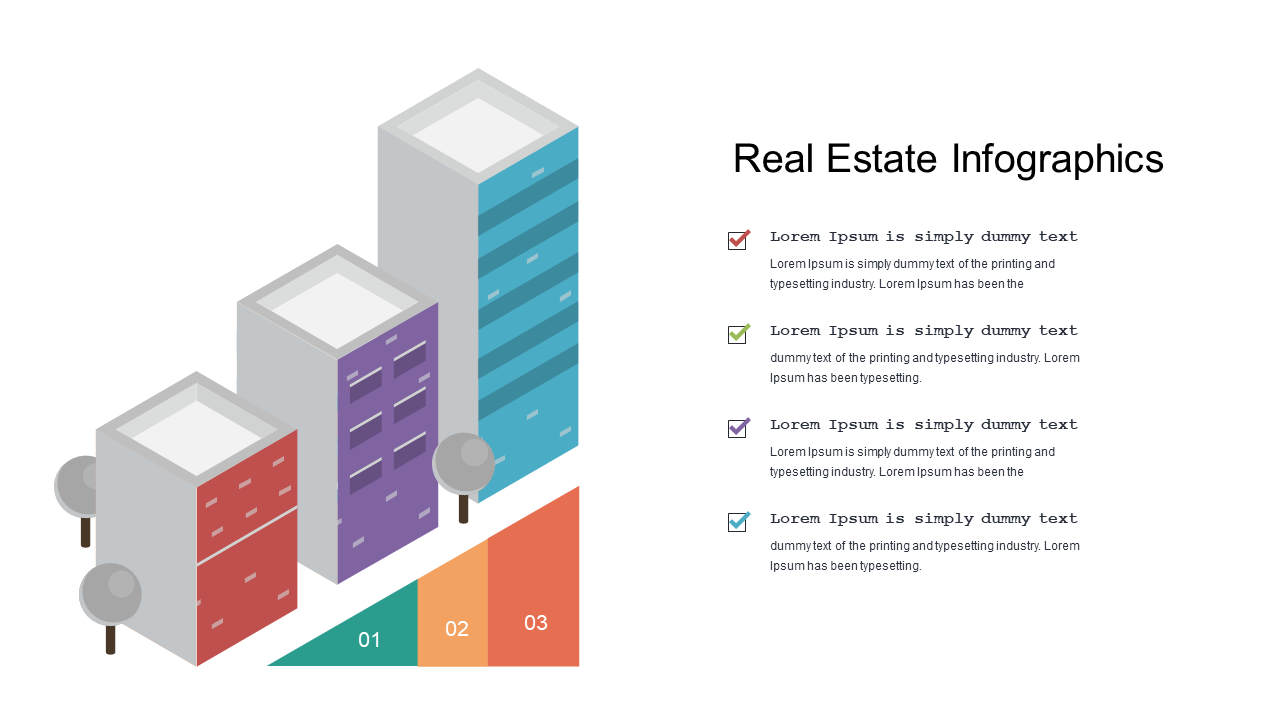
This slide features a striking 3D bar chart that simplifies your data and makes it visually appealing, ensuring your audience stays engaged. Real estate agents, market analysts, and property developers will find this slide particularly useful when presenting quarterly performance reviews or market trend analyses. Imagine walking into a meeting with potential investors or clients, and using this chart to clearly showcase property value trends or sales comparisons, making the information accessible and memorable.
At just $0.99, you can instantly download this slide, and it’s fully editable in PowerPoint and Google Slides. You’ll be able to tailor the visuals to your specific data in minutes, ensuring your presentation is both professional and effective.
$0.99 – Purchase Checkout
Added to cart







