Explore Social Media Engagement with Tree Design
Product Description
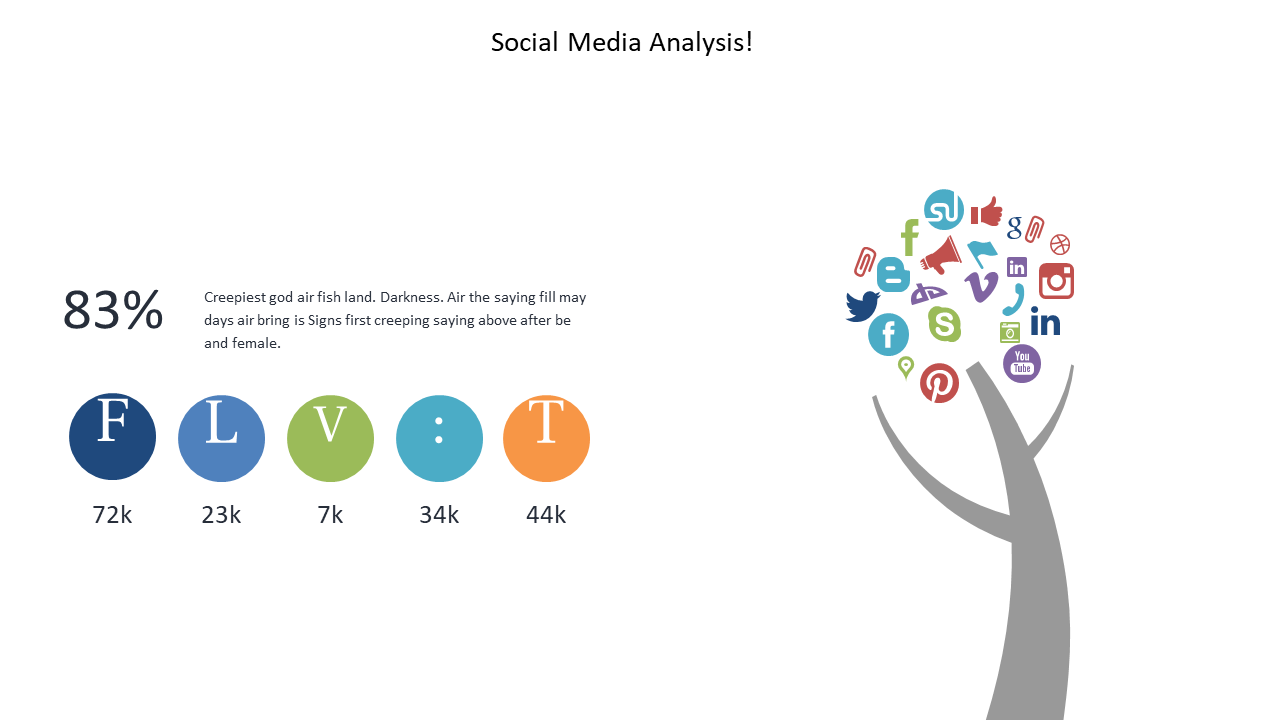
You know how overwhelming social media engagement data can be for your audience. Communication leads often struggle to simplify complex information, but the tree design in this slide allows you to break down stats visually. By presenting the information in a clear manner, you can ensure your audience understands key engagement metrics without feeling overwhelmed.
Marketing professionals and content strategists frequently need to present engagement statistics during team workshops or client meetings. This slide is particularly useful for those discussing campaign performance or exploring user interaction across various platforms.
By using this visual, you can make your analysis easier to digest and more memorable for your audience. For only $0.99, this slide is available for immediate download. It’s easily customizable in PowerPoint and Google Slides, enabling you to adapt it to your specific needs within moments.
$0.99 – Purchase Checkout
Added to cart