Circular Infographic for Engaging Social Media Stats
Product Description
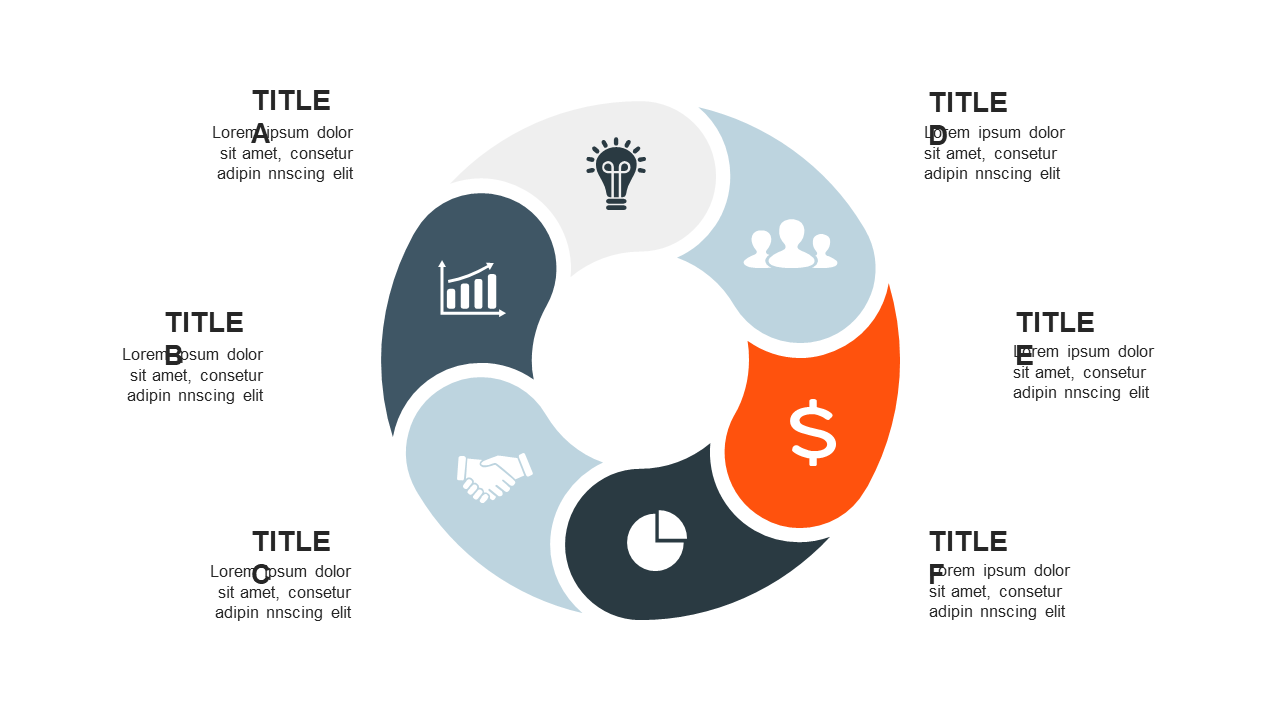
Presenting complex social media data can often lead to confusion rather than clarity. This circular infographic offers a practical solution by providing a visually appealing way to showcase user statistics across various platforms. You’ll be able to communicate important information effectively, making sure your audience understands the insights you want to convey.
Marketing managers and digital strategists will find this slide invaluable for team briefings or client presentations where engagement metrics are critical. It’s perfect for showcasing social media performance, allowing you to highlight user interactions, growth trends, or campaign successes with ease. The design ensures that your data stands out and resonates with your audience.
At just $0.99, this slide is an easy addition to your presentation toolkit. Download it instantly and edit it within PowerPoint or Google Slides to fit your specific needs. Get ready to engage your audience with compelling visuals and clear data today!
$0.99 – Purchase Checkout
Added to cart







