Visualize User Engagement with Circular Infographic
Product Description
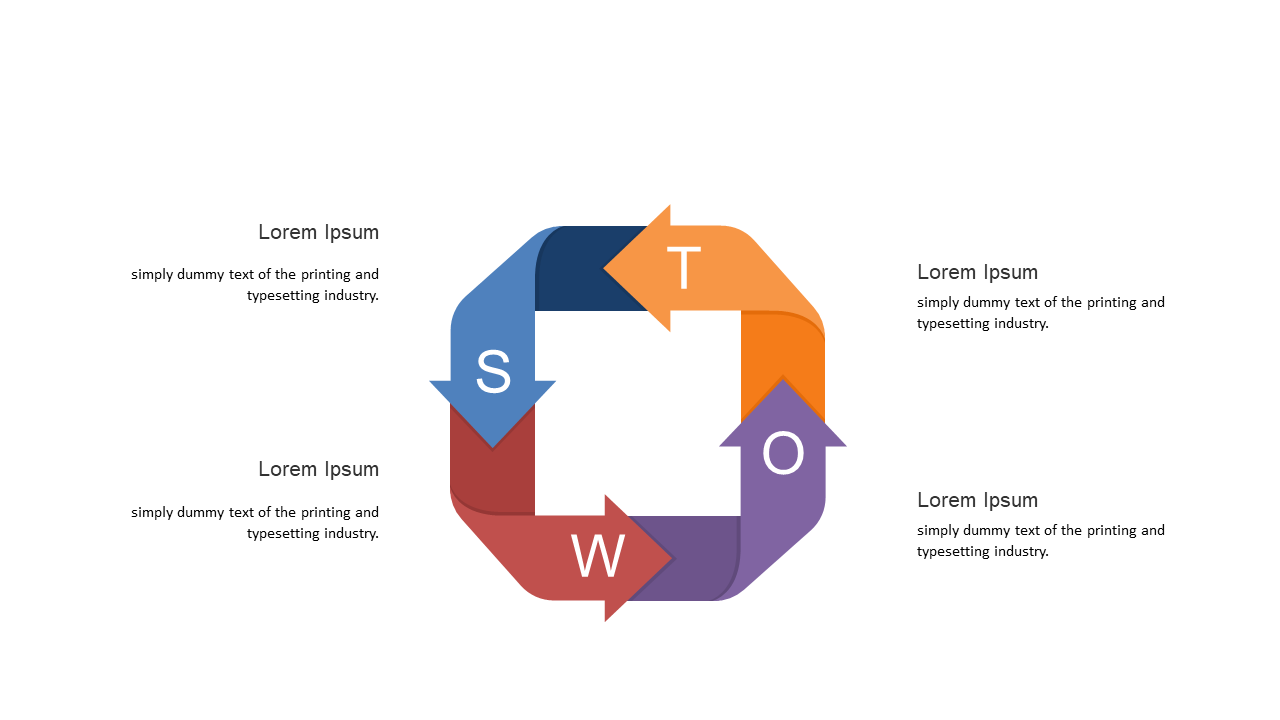
In a fast-paced communication landscape, presenting user engagement data clearly is vital for informed decision-making. You want to convey this information in a way that is easily understood and visually appealing. This circular infographic effectively visualizes user engagement across various social media platforms, transforming complicated statistics into a digestible format.
Ideal for social media managers, data analysts, and marketing professionals, this slide is perfect for sales meetings, performance reviews, or client briefings. By using this infographic, you can illustrate how different platforms are performing and where to focus future efforts.
It’s a smart way to make your data accessible and engaging. For only $0.99, you can download this infographic instantly, making it a quick addition to your presentation toolkit. It’s editable in both PowerPoint and Google Slides, allowing you to tailor it to your specific data and have your slides ready in minutes.
$0.99 – Purchase Checkout
Added to cart







