Showcase Social Media User Stats with Circular Infographic
Product Description
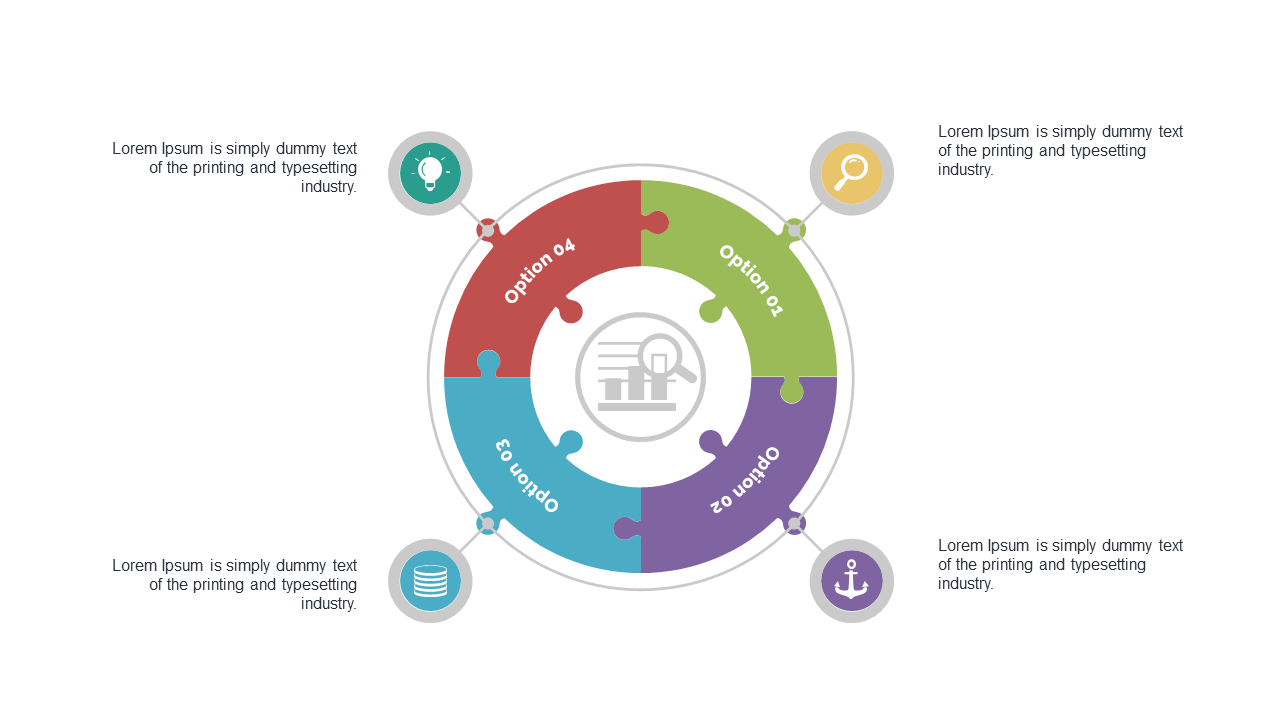
Presenting complex data can be a daunting task, especially when trying to keep your audience engaged. You need an effective visual tool that makes your information not only clear but also captivating. This circular infographic is crafted to specifically highlight social media user statistics, making your data pop on the screen.
This slide is perfect for content strategists, digital marketers, or analysts during strategy meetings, reporting sessions, or presentations to executives. It allows you to present user demographics, engagement rates, or platform performance in an engaging format that sparks discussion and insight. You’ll feel more confident delivering your data when it’s visually appealing.
Available for just $0.99, this slide is ready for instant download and can be easily edited in PowerPoint or Google Slides.
You can customize it to fit your needs in minutes, turning any presentation into a visually compelling story.
$0.99 – Purchase Checkout
Added to cart







