Present Social Media Metrics with Circular Infographic
Product Description
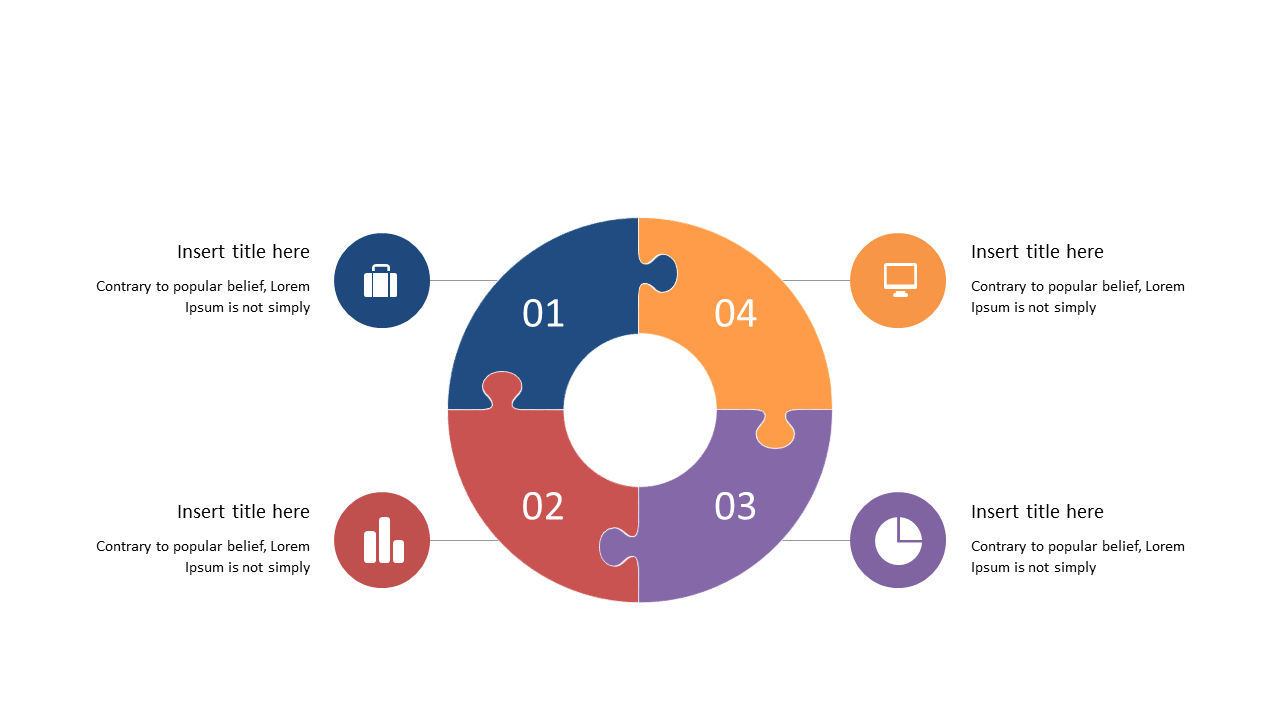
Marketing managers often struggle with the influx of social media data, making it challenging to convey performance effectively. You need a way to present these metrics that not only informs but also engages your audience. This circular infographic slide offers a vibrant and organized approach to display user statistics clearly.
This slide is ideal for marketing teams during performance reviews, strategy sessions, or presentations to clients. Whether you’re analyzing campaign effectiveness or comparing platform performance, this infographic enhances understanding and retention of the information you present.
Say goodbye to boring spreadsheets and hello to a more interactive way of storytelling with your data. At just $0.99, this slide is available for instant download, making it easy to get started right away. Editable in both PowerPoint and Google Slides, you can quickly update the content to match your specific metrics and have your presentation ready in no time.
$0.99 – Purchase Checkout
Added to cart







