Showcase Social Media User Statistics Visually
Product Description
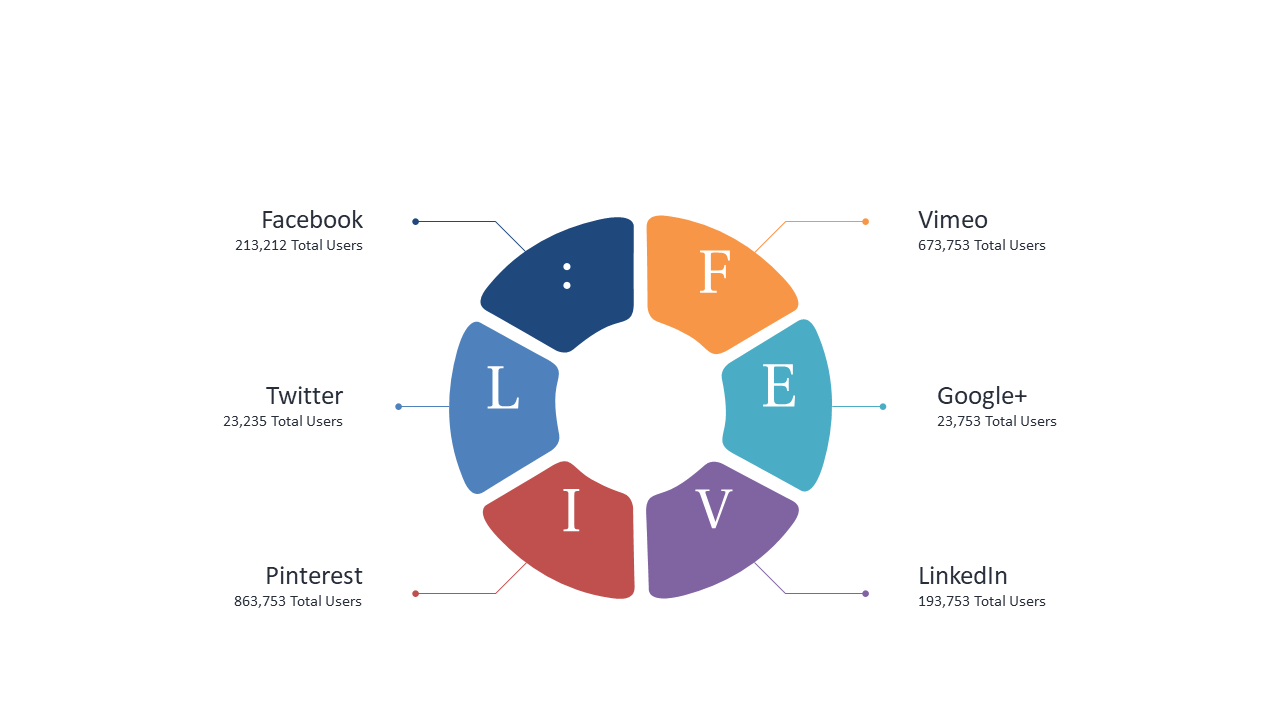
Capturing your audience’s attention while presenting data can be tough, especially when it comes to complex statistics. You want to convey your message clearly and engagingly, without overwhelming your viewers. This infographic slide simplifies intricate social media user statistics into a visual format that’s easy to digest.
Content strategists and social media managers will find this slide especially useful during team meetings, marketing presentations, or client pitches. It’s perfect for showcasing user engagement, demographic insights, or campaign performance in a way that promotes discussion and understanding.
Whether you’re outlining the success of your latest social campaign or analyzing user trends, this slide has you covered. For just $0.99, you can instantly download this eye-catching infographic, ready for editing in PowerPoint or Google Slides. It’s designed to be easily customized to fit your specific data needs, so you can get your presentation ready in minutes.
$0.99 – Purchase Checkout
Added to cart