Highlight Social Media User Data with Circle Infographic
Product Description
Are you tired of traditional bar graphs and pie charts that fail to engage your audience? Presenting social media user data can feel like a daunting task, especially when you’re trying to make it memorable.
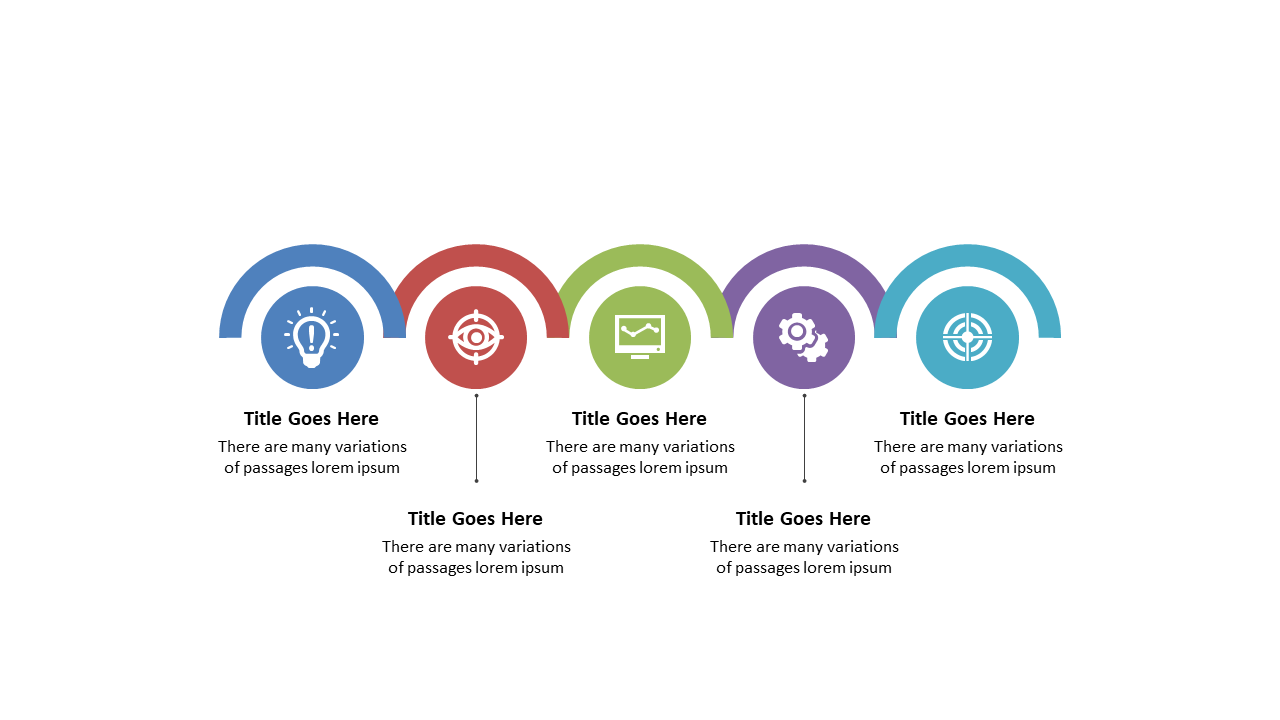
This circle infographic slide offers a vibrant way to highlight key metrics, turning dull statistics into engaging visuals. Perfect for content creators sharing social media growth stories, public relations specialists during media briefings, or business analysts reviewing trends in digital marketing.
Use it in client meetings or company-wide presentations to add a dynamic element to your data storytelling. For just $0.99, you can download this slide right away and adapt it seamlessly in both PowerPoint and Google Slides to suit your presentation style.
$0.99 – Purchase Checkout
Added to cart







