Visualize Metrics with Circular Indicators on Map
Product Description
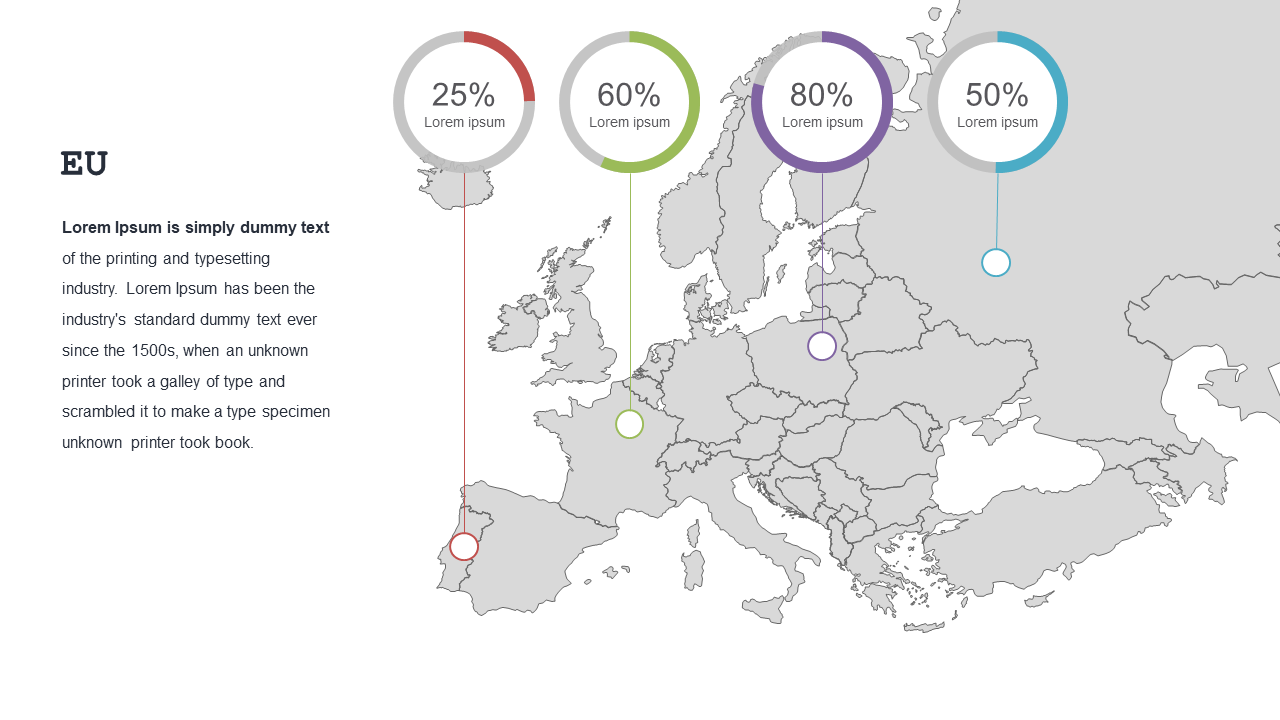
Marketing data can often feel like a sea of numbers, leaving your audience struggling to grasp key insights. This slide transforms your metrics into a visual narrative using circular indicators placed over a detailed map of Europe, making it easier for your team to understand the data at a glance.
This slide serves marketing managers presenting campaign performance, sales analysts discussing regional trends, or business developers showcasing market opportunities. The visual presentation helps communicate critical metrics without overwhelming your audience, ensuring your points land effectively.
For only $0.99, this slide is available for instant download and is fully editable in both PowerPoint and Google Slides. You can modify it to match your branding and make your metrics shine in just a few minutes.
$0.99 – Purchase Checkout
Added to cart







