Infographic for Comparing Three Countries’ Data
Product Description
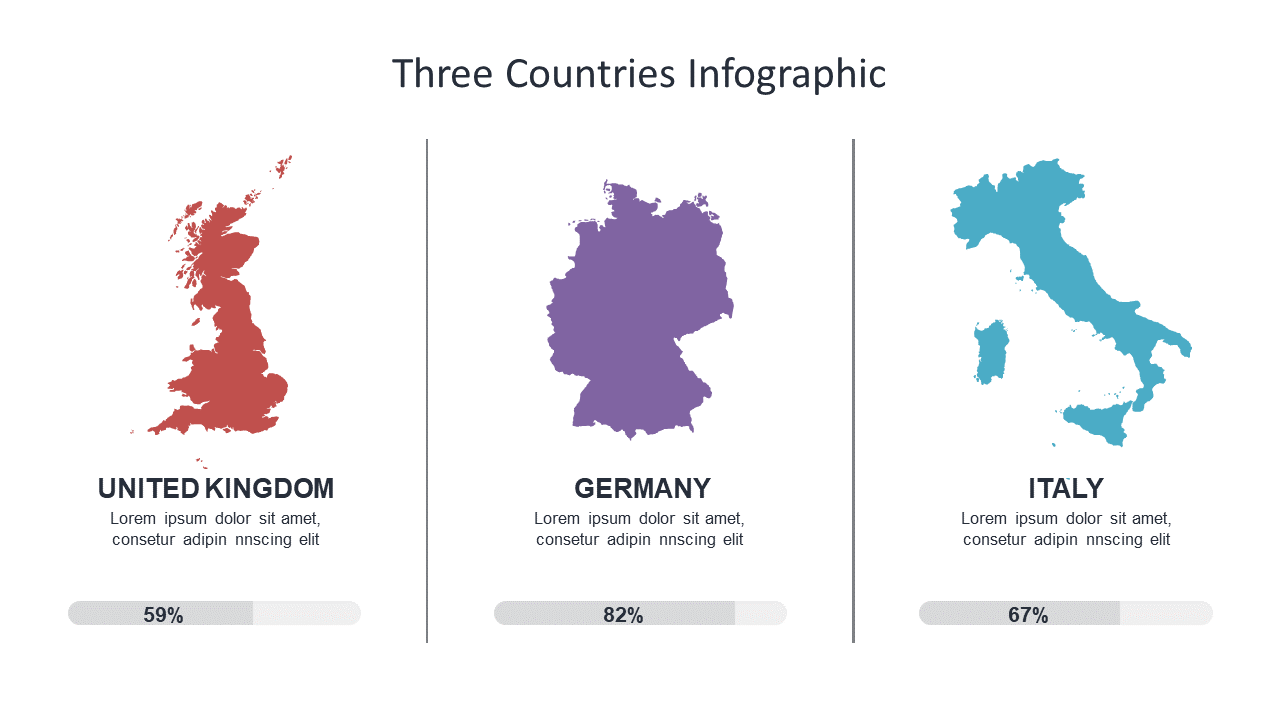
Finding the right way to visualize complex data can be a hurdle for many communications professionals. This infographic slide offers a clean and engaging design that showcases the outlines of three countries alongside relevant percentage data, making comparisons straightforward and easy to digest.
Public relations teams crafting reports on international outreach or educators presenting global statistics will benefit from this slide. It fits well into project updates, informative workshops, or any setting where clear visual comparisons are necessary.
For just $0.99, download this slide instantly and start customizing it to fit your presentation. It works seamlessly in both PowerPoint and Google Slides, making it easy to prepare your content quickly.
$0.99 – Purchase Checkout
Added to cart







