Engaging Circular Infographic for Key Concepts
Product Description
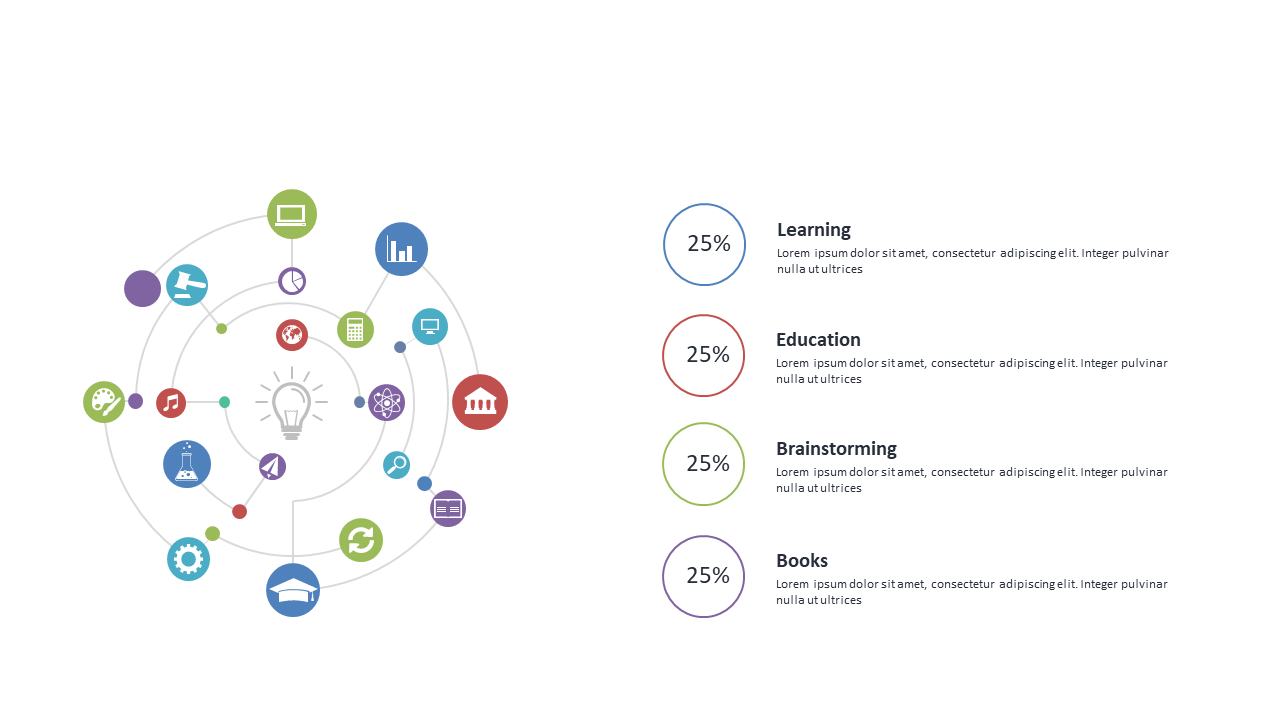
Conveying complex information in a straightforward and engaging manner can be a daunting task. This circular infographic slide breaks down key concepts into distinct segments, allowing for easy comprehension by your audience.
Its sleek design not only grabs attention but also organizes your content clearly without overwhelming viewers. Whether you’re an educator explaining theoretical frameworks, a consultant presenting findings to clients, or a team leader summarizing project deliverables, this slide is a perfect fit. Use it in training sessions, workshops, or team meetings where clarity and engagement are essential.
For just $0.99, this slide can be yours with an instant download. It is fully editable in both PowerPoint and Google Slides, making it easy for you to personalize your content in just a few clicks.
$0.99 – Purchase Checkout
Added to cart







