Track Progress with Colorful Step-Up Bar

Product Description
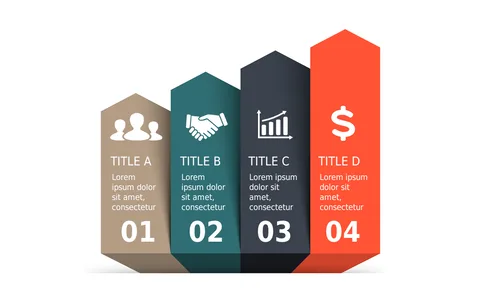
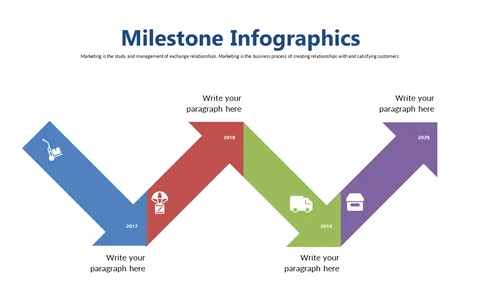
Conveying your project’s progress can be challenging, especially when trying to keep your audience engaged. This slide features a vibrant step-up bar that clearly illustrates milestones achieved, helping everyone grasp how far you’ve come.
It’s designed to make your progress easy to understand at a glance. You’ll find this slide useful if you’re a project manager reporting on deliverables, a consultant sharing updates with clients, or an executive reviewing departmental progress. In scenarios like project kickoff meetings or stakeholder briefings, this visual representation can add clarity and impact to your message.
For only $0.99, this slide is available for immediate download. You can easily edit it in PowerPoint or Google Slides to fit your specific project details in just a few minutes.
$0.99 – Purchase Checkout
Added to cart